By Mateusz Król
Historically, the Private Equity industry was divided into two general silos – Venture Capital and Leveraged Buyouts. Over time, both of these strategies have gained public attention with stories of spectacular successes and failures, leading to the enormous inflows of capital from institutional investors. Some of the largest companies in the world, such as Facebook, Google and Amazon, have used venture financing to grow and scale their business. However, the Venture Capital industry wasn’t free from controversies – especially after the dotcom bubble, which has caused investors and regulators to question (1) the valuations of VC-backed companies and (2) the supposedly “value-add” ancillary services these funds were providing to their portfolio companies (Hellman & Puri, 2002).
The Leveraged Buyouts firms have historically generated very attractive returns through a combination of financial engineering and operational improvement of their portfolio companies (PortCos). In the 1980s the attitude has changed due to several notorious corporate raiders – investors that used the LBO model to take over companies, often downsizing the operations of a firm through drastic cost cutting measures, liquidation of assets and elimination of jobs. The bankruptcy of Drexel Burnham Lambert, the Los Angeles-based investment bank that pioneered the Junk Bond market (the leading source of financing for Leveraged Buyouts) has also sent ripples throughout the Private Equity industry and caused this particular source of capital to temporarily dry up.
At the same time, some investors have specialised in a strategy that sits in the middle of the Private Equity spectrum with VC on one end and PE investments on the other, generating handsome returns for their LPs and staying mostly under the radar until very recently. While Venture Capital focuses on businesses in Early and Seed Stage and LBO investors usually target mature companies, Growth Equity works with companies in the expansion stage (Cambridge Associates, 2013). By virtue of being at the intersection of two larger strategies, there has been a lot of confusion surrounding a potential all-encompassing definition of this particular strategy.
Figure 1 Company life cycle graph

Source: Gatti S., Investment Banking, Teaching Materials a.y. 2020-2021
The most widely used definition of Growth Equity describes it as the capital designed to facilitate the target company’s accelerated growth by expanding operations, entering new markets or consummating strategic acquisitions. Historically, Growth Equity investments have been characterised as minority investments in targets with limited free cash flow without using much leverage to fund the investment (PE Hub, 2012).
Table 1 Comparison of different Private Equity strategies
| Venture Capital | Growth Equity | Buyouts | |
| Holding period | 5 – 10 years | 3 – 7 years | 2 – 5 years |
| Target IRR | 35 – 50% | 30 – 40% | 25 – 35% |
| Target MOIC | 5 – 10x | 3 – 7x | 2 – 5x |
| Control features | Minority | Typically minority | Control |
| Use of leverage | Little to none | Low | High |
| Profitability of target | Not profitable, cash burn | May or may not be profitable | Profitable and FCF generative |
| Use of proceeds | Product and business development | Customer acquisition, product enhancement, operational scalability | Purchase of equity from existing shareholders (replacement capital) |
Source: Workhorse Growth Capital
When we look at the capital loss ratio (defined as the percentage of fund capital in loss-generating deals over total invested capital of the fund) we see that Growth Equity is much closer to Buyouts than Venture Capital in that regard. In Venture Capital, a rule of thumb is that for every 10 investments made, 5-7 companies return less than liquidation value, 2-3 generate modest returns and 1-2 are home-run investments. We see that tendency in the data, with capital loss ratio of nearly 33% for US Venture Capital. Buyouts are generally perceived as strategies with more downside protection, as their investment targets are usually mature companies with stable cash flows and a strong tangible asset base. Hence, not surprisingly the capital loss ratio is the lowest for Buyouts, however Growth Equity isn’t very far behind, showcasing that in terms of risk of principal capital loss, Growth Equity is more similar to Replacement Capital than Early Stage investing (Cambridge Associates, 2019).
Table 2 Capital Loss Ratio by asset class in the US
| Asset class | Capital Loss Ratio |
| US Venture Capital | 32.7% |
| US Growth Equity | 13.7% |
| US Buyout | 11.7% |
Source: Cambridge Associates “Growth Equity: Turns out it’s all about growth”
One of the reasons why Growth Equity experienced such a surge in popularity is because it seems to outperform both Buyout and Venture Capital in the 3, 5 and 10 year horizon. In the graph below we can see periodic rates of return (net of fees) for the 3 strategies across different time horizons. Growth Equity clearly outperforms the two traditional Private Equity strategies, however due to limited sample size, the comparison over longer time horizons (20, 25 years) is not feasible.
Figure 2 Periodic rates of return (%) for different strategies in the US
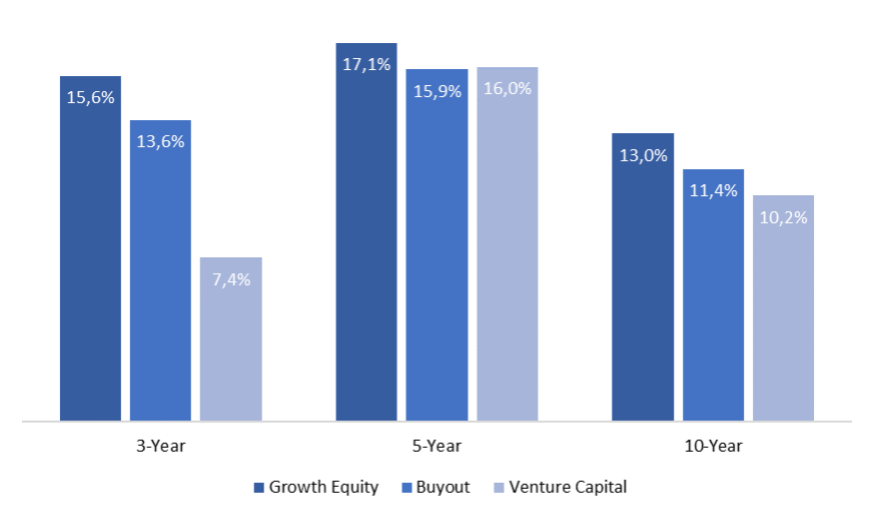
Source: Cambridge Associates “Growth Equity: Turns out it’s all about the growth”
The drawback is that Growth Equity investments require a much higher entry EV/EBITDA multiples than Buyouts. In 2008, the average EV/EBITDA purchase multiple for PE-owned Buyout companies was 7.9x compared to 11.6x for Growth Equity companies. By 2017, the gap between the two widened significantly, with Buyouts commanding an average multiple of 11.2x and growth of 18.0x. In the same time period, the average EV/EBITDA for the Russel 2500 index increased from 8.7x to 12.6x. What is causing this divergence? Investors are paying hefty premiums for growth and there seems to be a strong correlation between revenue growth rate and realised MOIC by investors. Between 2008 and 2017 the average annual revenue growth rate for PE-backed Growth Equity companies was 17.2%, more than double that of Buyout companies and more than triple that for public companies (Cambridge Associates, 2019).
The Growth Equity landscape
Historically, TA Associates, General Atlantic and Summit Partners have been considered the pioneers of the Growth Equity industry. However, over time many firms with very different origins and specialisations seemed to have entered this sector, seeking investments with larger growth potential than mature companies but with lower risk of capital loss than Early Stage firms (Goodwin Procter, 2013).
Several Venture Capital firms have moved upstream with some of them raising specialised funds focused on Late Stage investments. Well-known names such as Sequoia, Accel, TCV or General Catalyst have expanded their investment mandate, moving up market and writing larger checks for Growth Equity investments (Goodwin Procter, 2013). The lines between Venture Capital and Growth Equity are more blurred with firms such as Insight Partners, which does Venture Capital, Growth Equity and Buyout investments out of the same pool of funds.
Traditional Buyout shops such as KKR, Blackstone, TPG and Silver Lake have moved downstream, adopting Growth Equity in an attempt to create more diversified alternative investment management firms and to capitalise on this new market trend. Many of these firms already invest in a wide range of asset classes, including LBOs, real estate, credit and infrastructure, therefore Growth Equity is just another step in the race for assets under management. Surprisingly, we have also seen opposite moves, as with Warburg Pincus, which was a firm that traditionally focused more on Venture Capital and Growth Equity, but over the years transitioned into the LBO business.
Apart from traditional Private Equity investors, we have also witnessed Hedge Funds entering the Growth Equity market, especially long/short technology funds such as Tiger Global or Coatue, raising private markets investment funds in parallel to their public market investment vehicles (The Financial Times, 2020). Some Investment Banks have also started to invest their principal capital in Growth Equity, for example Goldman Sachs Growth (through their Merchant Banking Division) or Morgan Stanley Expansion Capital. Lastly, not only investment or more broadly financial firms, have been getting into the Growth Equity craze. The largest Growth Equity fund ever, the SoftBank Vision Fund, raised nearly $100bn to invest in Venture Capital, Growth Equity and Social Impact investments (TechCrunch, 2017). In fact, if we look at the 6 largest Growth Equity funds raised, half of them were raised by firms that we wouldn’t traditionally categorise as Growth Equity investors.
Table 3 The largest Growth Equity funds raised to date
| Fund name | Size | Year raised |
| SoftBank Vision Fund | $98.6bn | 2017 |
| TA Associates XIV | $12.5bn | 2021 |
| Insight Partners Fund XI | $9.5bn | 2020 |
| Sequoia Capital Global Growth Fund III | $8.0bn | 2018 |
| Tiger Global Private Investment Partners XIV | $6.7bn | 2021 |
| Insight Partners Fund X | $6.3bn | 2017 |
| Summit Partners Growth Equity Fund X | $4.9bn | 2019 |
Source: The Financial Times
In 2021, the fundraising craze doesn’t stop. In March, Blackstone Growth announced the closing of a $4.5bn fund, the largest first-time Growth Equity vehicle in history. In June, TA Associates announced the closing of its fourteenth flagship fund with total commitments of $12.5bn. Insight Partners is looking to raise $12bn for its flagship fund, which would be the third largest Growth Fund in history. Tiger Global is planning to raise a $10bn fund as well, just weeks after raising a $6.7bn fund. Tiger raised a $3.8bn fund XII in January 2020, displaying incredible speed of capital deployment (The Financial Times, 2021). There are many other Growth Funds in the pipeline – Thoma Bravo, the technology-focused Buyout firm, is looking to raise a debut $3bn Growth Fund, Providence Equity is pitching a $4bn Strategic Growth Fund IV and Iconiq Capital is in the process of raising $3.75bn for its Growth strategy (The Wall Street Journal, 2021).
Figure 3 Deal value and deal count of US Growth Equity investments (2010-2020)
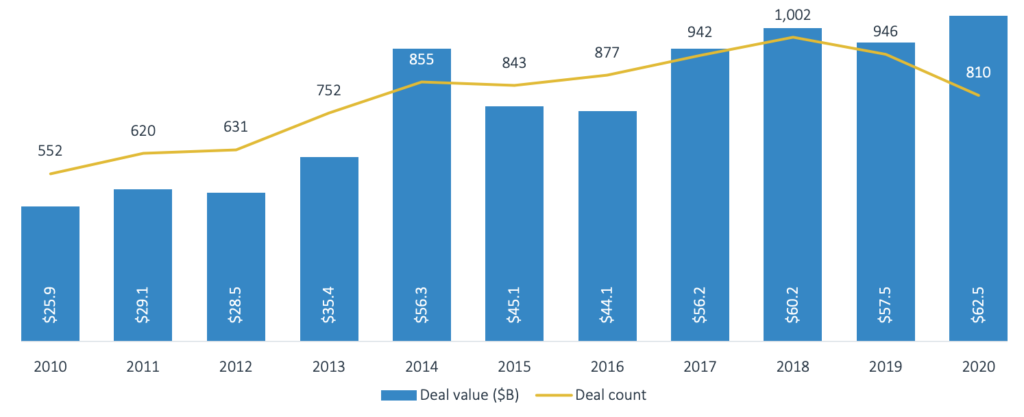
Source: PitchBook Annual 2020 US PE Breakdown
Number of Growth Equity deals in the US has grown steadily throughout the years apart from the 2018-2020 period. The record of 1,002 deals was reached in 2018 and the number subsequently dropped to 810 in 2020. Deal values have also experienced steady growth and despite the drop in deal count, value of Growth Equity deals reached an all-time high in 2020 at $62.5bn. The average Growth Equity investment has increased from $47m in 2010 to $77m in 2020, showing that GPs are signing larger and larger checks to high growth companies (PitchBook, 2021).
Trends
The rise of Growth Equity as an asset class can be explained by several secular trends that we have witnessed in the markets in the past years. The first, very obvious trend is the digitalisation of the economy. Rapid technological advancements, widespread access to the Internet and the ease of gathering data have caused the transformation of the global economy and companies that understand and take advantage of this new digital ecosystem are the ones that are rewarded with the highest market capitalisations. We can also credit this digital transformation with tearing down the entry barriers for new entrepreneurs. In the past, on-site servers and software costs used to account for a large portion of expenses for start ups. Now, firms can use the cloud to host their business and software tools that operate on a freemium basis, significantly reducing the upfront costs to set up a new company (Tran, 2020).
Back in 1965 Gordon Moore stated that the number of transistors on microchips will double every two years, defining what is now known as Moore’s Law – one of the most stunning examples of continuous technological advancement. More recently, a new term has been coined known as Bezos Law – the price of a unit of cloud computing power is reduced by 50% approximately every 18 months (O’Connor, 2014) Therefore, in general, setting up a Tech Start Up is now faster and cheaper than ever. Technology companies are good targets for Growth Equity investors, as they are characterised by highly scalable business models and limited overhead.
The second general tendency we have observed is that companies tend to stay private for longer as they are less and less interested in going public. We can observe that by looking directly at technology companies.
Figure 4 Median age at IPO of companies in the technology sector

Source: Ritter J., Initial Public Offerings: Median age of IPOs through 2020
We can see that the median age at IPO of technology companies nearly doubled from 1980 to 2020, rising from 6.5 to 12.5. In 2008, due to the Global Financial Crisis, capital was scarce, hence only the most established companies could obtain public markets financings, leading to the median age reaching the peak of 14. On the other hand, in 1999, the median age reached an historic low of 4, fuelled by the dotcom bubble and abundance of public market investors’ appetite (Ritter, 2021). Longer median age at IPO isn’t the only trend we have seen. In general, the number of publicly listed companies is dropping consistently, from over 30,000 in 1996 to just over 13,000 in 2017 (Federal Reserve Economic Data, 2019).
Figure 5 Number of listed companies in the US (1996-2017)
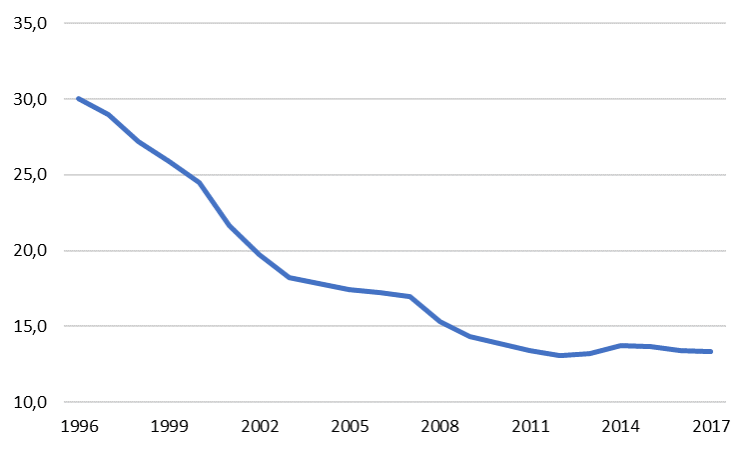
Source: Federal Reserve Economic Data
There are several reasons why companies tend to postpone going public. Firstly, the public scrutiny and costs related to being a public company act as a deterrent for highly valued private firms. Secondly, the proliferation of private markets investment vehicles have given companies easier access to financing without the burden of public markets. Thirdly, easier access to capital and higher fund inflows have caused the emergence of more Late Stage funding rounds and higher competition among investors, changing the dynamics of raising capital and giving companies more power. One could possible credit the SPAC boom to these factors as well – as firms are less and less interested in going public, the roles in the process of raising financing have been flipped. Now it’s the investors who have to initiate contact and look for investment targets and the companies can now pick and choose who can enter their capital structure.
Figure 6 Global annual Private Equity fundraising ($bn)
Source: McKinsey Global Private Markets Review 2021
Along with the increase in private markets fundraising, the allocation of capital by institutional investors has changed as well. In 2008, alternative investments amounted to 14.7% of institutional investors portfolio allocation, whereas in 2019 that increased to 21.8%. In general, we see GPs stray further from their specialisations and adopt new strategies in hopes of capturing AUM. In 2019, non-flagship funds accounted for more than 50% of fundraising among the 10 largest GPs and with that came significant product proliferation – among the same group of GPs, there was an average of 7 active product families in 2020 compared to just 2 in 2010 and only 1 in 2000 (McKinsey, 2021).
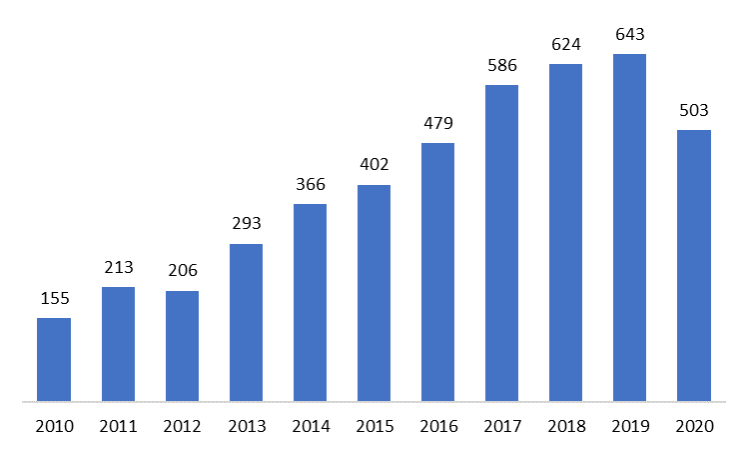
The surge in funds raised and product proliferation among alternative asset managers have led to increased competition among investors. We are now seeing more funding rounds, with companies seeking financing in Series E and beyond. Series D+ financing accounted for 21% of total capital raised by Tech companies in 2004, in 2015 that figure grew to nearly 40% as $30bn of financing was raised in the Late Stage rounds (McKinsey, 2016).
Figure 7 Capital invested in tech companies by series ($bn)
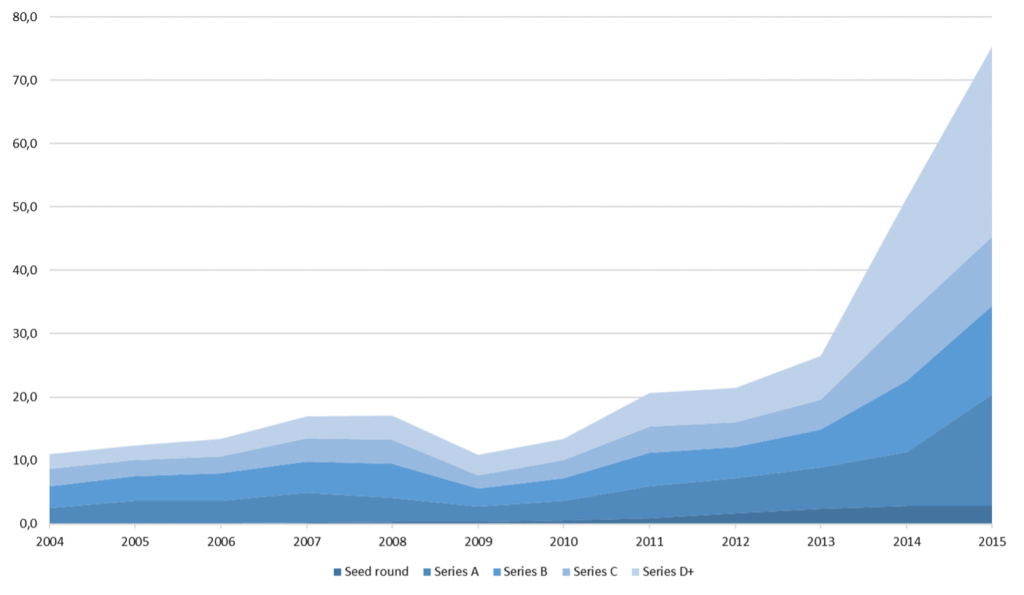
Source: McKinsey “Grow fast or die slow: Why unicorns stay private”
The most recent trend in the market has been the astounding pace of capital deployment from several private investment funds such as Tiger Global or SoftBank. SoftBank, perhaps the most polarising example, has raised nearly $100bn for the Vision Fund in May 2017 and invested 85% of it by September 2019, reserving the last 15% for follow-on investments, mandatory disbursements and fund management fees. It means that SoftBank has invested $83.8bn in around 845 days – just shy of $100m per day (TechCrunch, 2020). In 2021, Tiger Global, the already mentioned technology-focused hedge fund, participated in 100 investment rounds over a 120 day span, disrupting the traditional due diligence processes and offering hefty valuations to beat the competition (The Financial Times, 2021). This race to deploy capital is already starting to show in valuations.
While Early Stage valuation have remained fairly stable over the years, Late Stage financings have exhibited tremendous growth, especially in the 2016-2019 period. The median series D+ pre-money valuation reached $360m in 2019 compared to $140m in 2016. Unicorns (>$1bn private valuation) and decacorns (>$10bn private valuation) have become more of a common sight than the exception, possibly signifying too much money chasing too few deals leading to high competition and rising valuations in the sector. As of March 2021, there were 611 unicorns and 31 decacorns according to CB Insights, of which an increasing number has reached the $10bn threshold only through private financing (for instance Palantir, Uber, Snapchat, Dropbox).
Figure 8 Median pre-money valuation by stage of financing ($m)
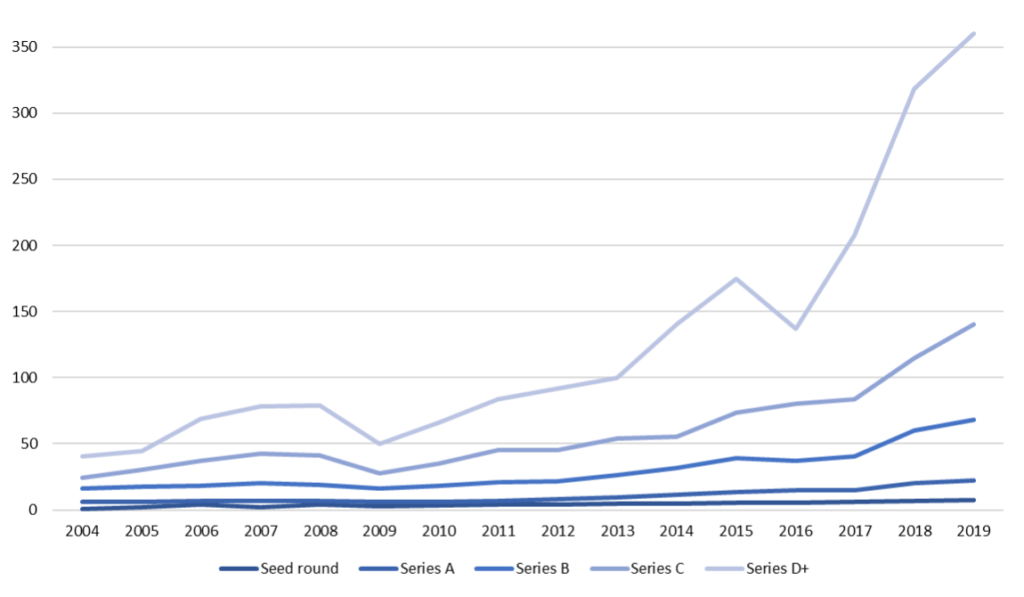
Source: Cambridge Associates “Venture Capital Positively Disrupts Intergenerational Investing”
It seems that the system has developed a process of funding highly valuable technology companies starting from accelerators (such as Y Combinator) to Venture Capitalists and Growth Equity investors. The importance of public markets in this value chain appears to have declined significantly and going public is now being considered simply as a liquidity event, rather than a transformative moment in a company’s history.
Growth Equity attracted investors by offering superior returns given its risk profile. As a strategy historically at an intersection between Venture Capital and Leveraged Buyouts, it was often misunderstood, but nowadays it has developed several characteristics that distinguish it from other Private Equity strategies. The returns speak for themselves and with the recent fundraising efforts, Growth Equity has established itself as the hottest area of private market investing.
Author: Mateusz Król
Editor: Jakob Müller
Sources:
Mooradian P., Auerbach A., Slotsky C., Gilfix J., Growth Equity: Turns out it’s all about the growth, Cambridge Associates, January 2019, obtained from:
https://www.cambridgeassociates.com/insight/growth-equity-turns-out-its-all-about-the-growth/
Mooradian P., Auerbach A., Quealy M., Growth Equity is All Grown Up, Cambridge Associates, June 2013, obtained from:
https://www.cambridgeassociates.com/insight/growth-equity/
Austin M., Thurston D., Venture Capital Positively Disrupts Intergenerational Investing, Cambridge Associates, January 2020, obtained from:
Workhorse Capital, What is Growth Equity, obtained from:
http://workhorsegrowth.com/perspective/growth-equity/
Kruppa M., Tiger Global seeks $10bn for record tech venture fund, The Financial Times, May 2021, obtained from:
https://www.ft.com/content/11834bc1-f9b3-43a8-b142-7e890d85a11e
Kruppa M., Stampede for Silicon Valley start-ups sees VCs invest at fast pace, The Financial Times, March 2021, obtained from:
https://www.ft.com/content/9e6b7543-3000-45e5-aee8-e8ccc9b5f661
Insight Partners, Insight Partners Closes Growth Equity Technology Fund XI at $9.5 Billion, April 2020, obtained from:
Russell J., SoftBank’s massive Vision Fund raises $93 billion in its first close, TechCrunch, May 2017, obtained from:
https://techcrunch.com/2017/05/20/softbank-vision-fund-first-close/
Crichton D., Tabatabai A., The first Vision Fund is officially done investing (and spent $100M every day of its existence), TechCrunch, May 2020, obtained from:
AnalyzeMarkets, Tiger Global Raises USD 6.7bn for Its Largest-ever Venture Capital Fund, April 2021, obtained from:
Tiwary A., Tiger Global raises USD 3.8 billion, might lead USD 500 million round in Tencent-backed Dream 11, Kr Asia, January 2020, obtained from:
Singh P., Thoma Bravo Targets $3 Billion for Debut Growth Fund, The Wall Street Journal, April 2021, obtained from:
https://www.wsj.com/articles/thoma-bravo-targets-3-billion-for-debut-growth-fund-11618527685
Federal Reserve Economic Data, Number of Listed Companies for United States, October 2019, obtained from:
https://fred.stlouisfed.org/series/DDOM01USA644NWDB
Solomon D., Bryan-Low C., Companies Complain About Cost of Corporate-Governance Rules, The Wall Street Journal, February 2004, obtained from:
https://www.wsj.com/articles/SB107636732884524922
Erdogan B., Kant R., Miller A., Sprague K., Grow fast or die slow: Why unicorns are staying private, McKinsey & Company, May 2016, obtained from:
O’Connor G., Moore’s law gives way to Bezos’ Law, GigaOm, April 2014, obtained from:
https://gigaom.com/2014/04/19/moores-law-gives-way-to-bezoss-law/
Tran T., Startup costs: Expenses You Should Include In Your Plan, Silicon Valley Bank, 2020, obtained from:
https://www.svb.com/blogs/tina-tran/startup-costs-expenses-plan
The Blackstone Group, Blackstone Announces $4.5 Billion Final Close of Blackstone Growth (BXG) Fund, Largest First-time Growth Equity Vehicle in History, March 2021, obtained from:
Cumming C., Iconiq Targets $3.75 Billion for Sixth Growth Fund, The Wall Street Journal, April 2021, obtained from:
https://www.wsj.com/articles/iconiq-targets-3-75-billion-for-sixth-growth-fund-11619562096
Singh P., Providence Strategic Growth Pitches $4 Billion Fifth Fund, The Wall Street Journal, April 2021, obtained from:
https://www.wsj.com/articles/providence-strategic-growth-pitches-4-billion-fifth-fund-11617390007
CB Insights, $1B+ Market Map: The World’s 600+ Unicorn Companies In One Infographic, March 2021, obtained from:
https://www.cbinsights.com/research/unicorn-startup-market-map/
Hellman T., Puri M., Venture Capital and the Internet Bubble: Facts, Fundamentals and Food for Thought, March 2002, Graduate School of Business, Stanford University, obtained from:
Baboolall D. et al, McKinsey Global Private Markets Review 2021, McKinsey, April 2021, obtained from:
Ritter J., Initial Public Offerings: Median age of IPOs through 2020, University of Florida, January 2021, obtained from:
https://site.warrington.ufl.edu/ritter/files/IPOs-Age.pdf
Fernyhough W., Springer R., PitchBook 2020 Annual US PE Breakdown, PitchBook, 2021, obtained from:
https://pitchbook.com/news/reports/2020-annual-us-pe-breakdown
LeClaire J., McCusker A., Kendall M., Growth Equity – The Crossroads Sector Comes to the Fore, Goodwin Procter, August 2013, obtained from


Comments are closed.