by Jonas Kurth and Philip Schröpel
Introduction
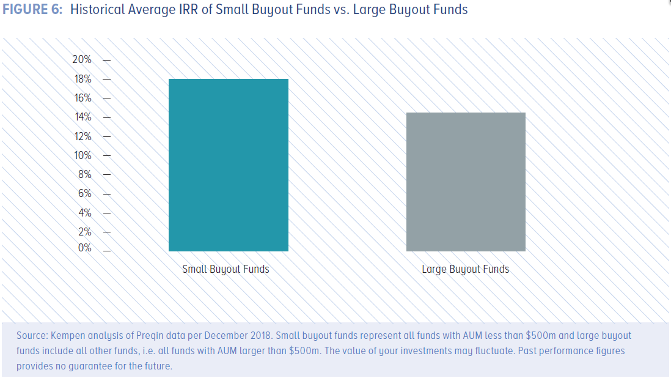
In recent years, Private Equity has seen an increasing number of deals as well as enormous returns for investors. Decreasing entry barriers and high levels of dry powder paired with low interest rates resulted in a well-oiled engine for the asset class that is known for harvesting appealing returns. While the public equity markets’ performance in the past two years was marked by massive volatility in the course of the COVID-19 pandemic with the VIX peaking at roughly the fivefold of its usual level in March 2020, the private equity market showed steady and above-market returns for investors (Bain & Company, 2021). But how to further improve the asset allocation within private equity? Which fund patterns should investors look out for to achieve the highest IRR? One pattern could be the fund size. It is notable that in the past, small buyout funds returned a net IRR of c. 18% on average, outperforming larger funds that yielded circa 350 basis points less (Kempen, 2019).
What reasons are causing the gap in returns? This article describes the main academic findings and gives first-hand practical insights.
Analysis
It is evident that the impact of a fund’s growth in assets under management (AUM) on its performance does statistically not differ from zero, implying that the growth of Private Equity funds itself does not have a statistically significant impact on its performance (Rossi, 2019). This observation goes hand in hand with the fact that larger fund sizes do not necessarily mean an increase in the ticket size a fund deploys for its investments, which is, however, often the case. Instead, the return gap is the result of various market-wide steps in the overall value chain of a private equity fund that let smaller funds perform in a different way than larger ones.
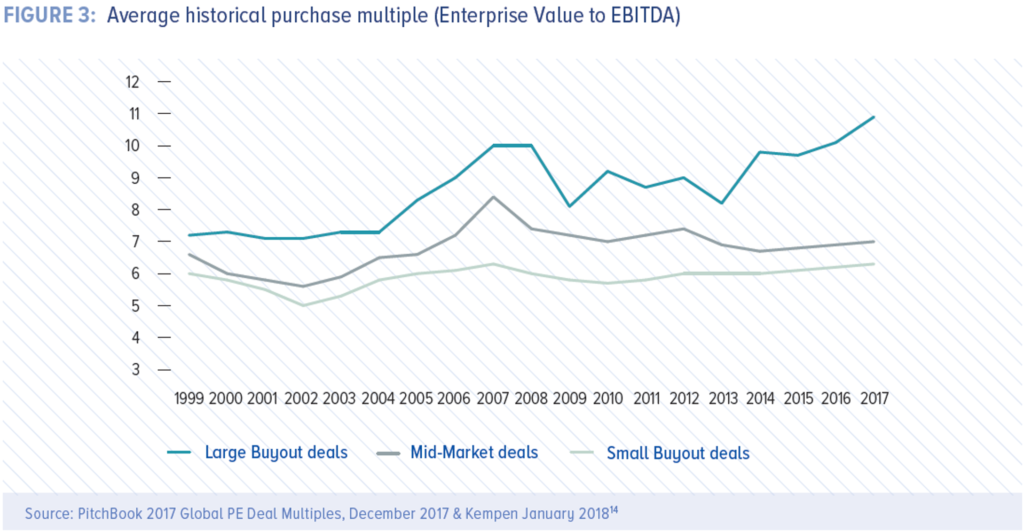
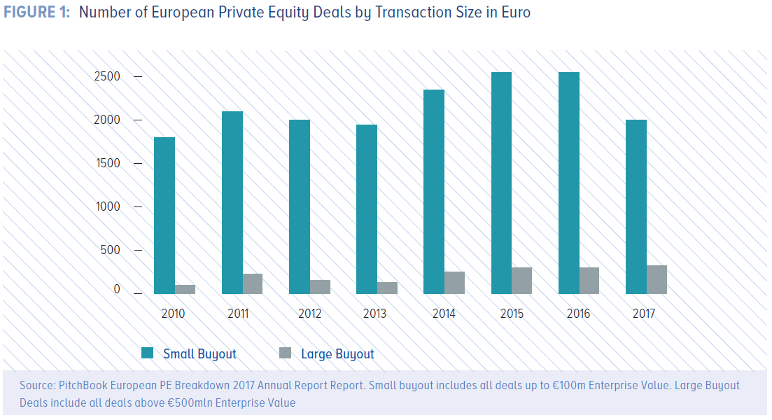
Beginning with the pre-process steps, it is notable that the overall number of potential longlist candidates is significantly higher for SME funds than for large buyout funds. Small- and medium-sized companies account for around 99.8% of all active entities within the European Union, which translate into approximately 74% of funds that are categorized in the small- and mid-market segment (Preqin Ltd., 2015). This is, i.a., also the reason why the number of medium buyouts (EV < €500m) is more than fivefold the one of such with an EV above €500m and the one of small buyouts (EV < €100m) is even more than fifteenfold the number of medium to large ones (EV > €100m) (Kempen, 2019). Breaking potential candidates further down and focusing on the initial contact, small funds usually proactively scour the company landscape for targets that meet their fund’s investment criteria to approach shareholders. Contacting shareholders without any intermediaries (i.e., investment banks) (a) saves on fees and (b) results in lower entry multiples (on average c. 4.5x less; see figure 2) from not being part of “bidding wars” within structured M&A processes (Rossi, 2019). In comparison, the targets of large-cap companies are often acquired in M&A auctions, mainly due to size and complexity constraints. This raises the entry price due to, i.a., (a) bidding competition, (b) transaction structure drawbacks, i.e., dissuading buyers from earn-outs or vendor loans – often driven by M&A consultancies –, which would lower the equity input of funds and increase the return as a result, and (c) overall process optimization to maximize sellers’ benefits (at buyers’ expenses). Once contacted, the possibility to receive the opportunity for a majority investment is high as small- and mid-market companies are often family-led. In optimal cases, such companies are also in a succession situation, which can, for instance, be determined by screening for the majority shareholder’s age. However, sourcing in this segment is also more challenging because (a) the screening and structuring of longlists consume many resources, (b) financial information is only scarcely disclosed, and (c) low equity requirements can only cover the capital commitment of smaller funds’ LPs or require a very robust deal pipeline, which could go along with higher management fees to cover higher personnel costs (Kempen, 2019).
Going on with the process steps, it is notable that the deal structuring itself is more conservative for small-cap companies, i.e., less leverage is applied. While targets of booming industries like healthcare and TMT can be levered at up to 7x EBITDA in larger deals, the leverage applied on smaller targets is often capped at 2x. This is not only the decision of the investment team but also the one of financers, who are often smaller and more conservative banks, which do not necessarily value an investment by its future cash flows like leveraged finance teams and debt funds would do but purely by its current, past-oriented balance sheet instead.
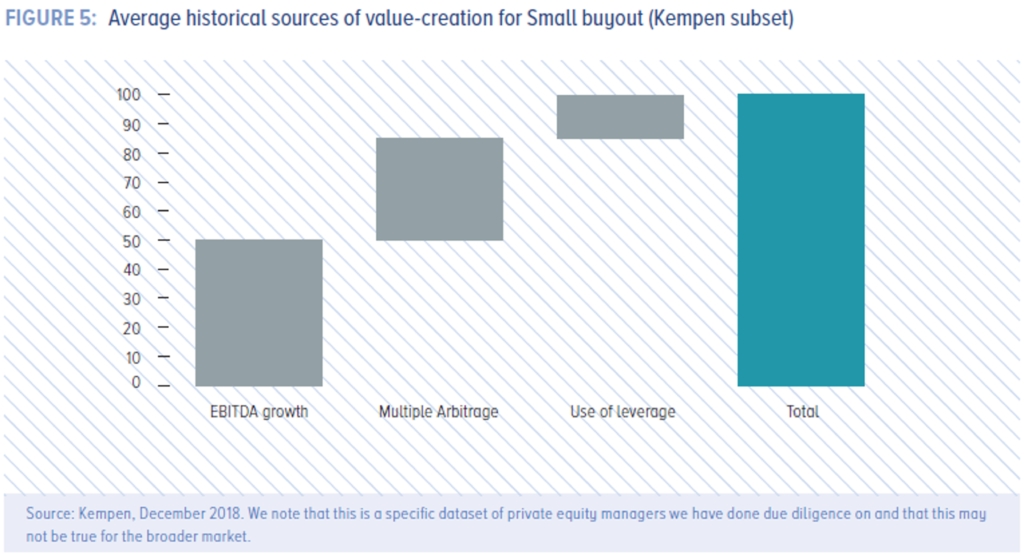
Focusing on post-process steps, it is notable that, due to the usually family-held structure, such companies often offer immense operational value creation potential. Both top-line growth, with respect to organic growth (e.g., internationalization), as well as inorganic growth (i.e., buy-and-build), and bottom-line improvements (i.e., operational efficiency leverage) are major value drivers. Thus, the dependence on leverage, as is the case in large-cap buyouts, is much lower for small buyouts. On average, the value creation bridge comprises c. 50% EBITDA growth, c. 35% multiple expansion, and c. 15% cash generation (Kempen, 2019).
Conclusion
In summary, lower returns of larger buyout funds emerge mainly from pre-process characteristics, i.a., generally less targets in the market and M&A consultancies as intermediaries, which lead to higher prices, higher transaction fees, transaction structure drawbacks, and overall process optimization to maximize sellers’ benefits at buyers’ expenses. Value creation is further boosted by higher EBITDA growth potential, both in the top- and the bottom line, thanks to the “unsqueezed lemons”, i.e., inefficient, family-held companies that did not experience streamlining yet. However, large buyout funds benefit in the process itself by being able to apply significantly higher leverage compared to small transactions, which nevertheless, do not pay off as the returns reflect. To address this opportunity, large-cap players are already raising dedicated small- and mid-cap funds in order to potentially lower multiples and broaden the horizon of acquisition opportunities.
Implications for LPs are clear and in line with Fama-French’s small-minus-big-factor: small companies tend to outperform larger companies. Investors are already aware of this gap. 51% of LPs of Preqin’s investors survey in June 2015 stated that SME funds are offering the best private equity investment opportunity while only 10% see large funds and megafunds as the currently best opportunity (Preqin Ltd., 2015). Focusing on other stakeholders, the results also have implications for carry-participating private equity professionals and might lead them to weigh the prestige of megafunds against the variable compensation upside of small-cap funds, which might offer more appealing compensation.
However, one should always keep in mind that higher returns always go hand in hand with higher risk, which could arise from a less diversified income stream, a less experienced management team, and less liquid assets in the case of small-cap companies (Kempen, 2019).
Sources
http://- https://www.bain.com/insights/topics/global-private-equity-report/
http://- https://www.kempen.com/en/news-and-knowledge/whitepaper/small-is-beautiful
http://- https://docs.preqin.com/newsletters/pe/Preqin-Private-Equity-Spotlight-August-2015.pdf
http://- https://centers.tuck.dartmouth.edu/uploads/cpee/files/Rossi_Pe_Decreasing_Returns_2018.pdf
Editor: Francesca Paduano


Comments are closed.